Balance Sheet Analysis
Abercrombie & Fitch Company uses common stock, paid in capital and retained earnings to fulfill the requirement of external capital. Hennes & Mauritz issues its share capital, reserves and retained earnings to gather the required capital (H&M, 2010). So, both companies have not issued preferred stock shares to fulfill their capital requirements. H&M not uses treasury shares, but A&F reports treasury shares for restricted stock units outstanding. A&F issues shares of common stock for stock options and restricted stock unit vesting from treasury stock. A&F uses treasury stock to settle stock options, stock appreciation rights and restricted stock units outstanding (ABERCROMBIE & FITCH CO, 2011). H&M utilizes treasury stock to settle stock options without repurchasing additional shares of common stock.
Income Statement Analysis
Basic earnings per share of A&F are $1.71 and diluted earnings of share for company are $1.67 in 2010. In H&M, basic earnings per share are $11.29 and diluted earnings per capital are also $11.29 in 2010 (Bloomberg.Com, 2012). Basic and diluted earnings per shares of both companies show that H&M earn more profit compare to A&F. It indicates that H&M have high potential dilution for the company’s shares and its investors can earn more return on their investment. Market shares and earning capacity of A&F is less effective than its competitor H&M.
Both companies have not reporting any discounted operation in 2010, but A&F has reported $78699 loss from discontinued operations due to loss in operations of company’s 29 RUEHL branded stores and direct-to-customer operations (ABERCROMBIE & FITCH CO, 2011). The company decided to close the RUEHL branded stores and related direct-to-customer during the fourth quarter in 2009.
H&M doesn’t disclose any stock compensation plan. A&F discloses two primary share-based compensation plans that is 2005 and 2007 Long-Term Incentive Plan (LTIP). The 2007 LTIP permits A&F for covering up to 2.0 million shares annually and the 2005 LTIP allows company to annually grant awards covering up to 250000 shares of A&F’s common stock. The company uses fair value method to estimate the expected term of the stock options (ABERCROMBIE & FITCH CO, 2011). The company uses the weighted-average assumptions to calculate the fair value of the restricted stock units granted. The total fair value of restricted stock units is $17.9 million in January 2011 and $11.5 million in January 2010.
Financial Ratio Analysis
Financial ratios provide information regarding the financial position of an organization. Following are the ratio that provides important information for the financial position of A&F and H&M:
Profitability Ratios
Profitability ratios define the profitability position of the firm in a particular period. Following table shows the profitability ratios for both the firms:
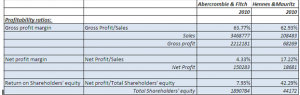
The profitability ratio shows that the profit margin of both the firms is good as they are earning huge gross profit over the sales, which shows their significance to reduce the cost of goods sold (Brigham & Houston, 2012). The gross profit margin shows the relationship between gross profit and sales of the business. It is the net income that is earned by the firm after deducting all business expenses from the total revenue. It is the best measurement of growth of a firm. The new profit margin of A&F is 4.33%, while for its competitor H&M; it is 17.22%, which is quite high. It shows that A&F is less effective to earn significant amount from its operations. The operating expenses of the firm are higher in the comparison of its competitors.
Return on shareholders’ equity (ROE) helps to determine the earnings over the investment made by owners within the business. It helps to access the soundness of business to earn revenue for the investors and to increase the value of their investment (Vandyck, 2006). ROE for A&F is 7.95%, which is significantly less from H&M, its competitor, which have 42.29% ROE. It shows that H&M is generating higher value for its shareholders then A&F and it will be more attractive investment from investors’ point of view.
This group of ratio exhibits that the profitability of A&F is quite low in the comparison of its competitors, while cost of goods sold is less for it compare to H&M. It also depicts that A&F has to consider its operating expenses as they are high then other firms in the industry, which is declining its net income and return for shareholders. (Vasigh, Fleming & Mackay, 2010) Analyst could determine the current and future ability of both the firms to earn the revenue from its sources through this ratio group.
Liquidity Ratios
Liquidity ratios define the short-term solvency position of the firm or ability of the firm to pay its short-term financial obligations timely (Brigham & Houston, 2012). Following are the Liquidity ratios for both the firms:
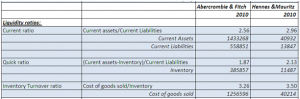
The current ratio of the firm exhibits its ability to pay its current liabilities. Both the firms have significant amount of current assets to pay its current liabilities, which is a positive sign for short-term investors of the firm. But at the same time, both firms should focus over the management of their working capital and current assets as they have excess amount of current assets for paying current liabilities (Vasigh, Fleming & Mackay, 2010). Quick ratio determines ability of the firm to pay its current liabilities on demand. It is not possible for a firm to obtain finance from inventory and prepaid expenses on demand, so both are not included in quick assets. The ratio depicts that both firm has significant amount of quick assets to pay all the current liabilities on demand. Inventory turnover ratio exhibits the ability of the firm to turn its total inventory into sales in a particular time period. This ratio exhibits that both the firms are equal to change their inventory into sales and to rotate the working capital within the firm. It also exhibit efficiency of the both the firms to run their operations (Vandyck, 2006).
An analyst could determine the managerial efficiency of the firm from liquidity ratios. It is also significant to determine, whether firms; short-term solvency position is effective or not. A short-term investor could take appropriate decision whether to invest or not through these ratios. It is also significant to determine working capital management within the firm and estimate the operational efficiencies or difficulties in coming years (Vasigh, Fleming & Mackay, 2010).
Leverage Ratios
Leverage ratios define the capital structure and also the long-term solvency position of a firm (Brigham & Houston, 2012). Following ratios are calculated in this context for both the firms:

Debt to asset ratio determines the claim of creditors over total assets. The ratio depicts that A&F is using higher amount of debt in its capital structure as creditors could claim on 36% of total assets. On the other hand, H&M’s creditors holds only 25% claim over total assets. Similarly, debt to equity ratio determines the total capital structure of the firm by identifying the total external internal capital portion (Vandyck, 2006). From the ratio, it could be determined that A&F is using higher amount of debt in its capital structure, while H&M is using less amount of debt in its total capital structure. Times covered ratio is beneficial to determine how easily a firm could pay interest or financial expenses on outstanding debt. A&F have significant amount of income to pay its interest expense, but it is less in compare to H&M. It is because of the less amount of debt in the capital structure of H&M from the debt in capital structure of A&F.
From these ratios, an analyst could determine the long-term solvency position and risk for the investors in a business. A higher amount of debt includes the higher risks for the shareholders as first claim over the assets is for creditors (Brigham & Houston, 2012). At the same time, it also increases the financial obligations on the outstanding debt, which may reduce the financial position of the firm.
Informative Sources
Balance sheet, income statement and ratios are the most informative sources for businesses and stakeholders. Balance sheet provides information to stakeholders about the company assets, liabilities and shareholders’ equity. It helps to determine the changes in financial position of a firm within one year time period. Balance sheet is informative for investors to know about the business and the value of their investment (Spurga, 2004). Income statement is informative to analyze the financial performance of company. It is significant to determine the ability of a firm to utilize its resources and to generate significant return for shareholders and other investors. Income statement is a record of the company’s profitability and represents the growth of the company (Fridson & Alvarez, 2011). Income statement, cash flow and balance sheet is most informative for stakeholders because it explains the position and situation of the company. Ratio analysis is also helpful to determine the relationship between different variables of the firm and to exhibit current and future performance.
Footnotes to the financial statements provide information about the company’s financial policies and practices, so it is important to depict the company’s financial condition and results. Footnotes provide detailed information about the accounting policies and practice of the business and also the methods that are used to determine particular data. The notes disclose about the assets, liabilities, stock options and taxes and costs of these programs and indicate performance of company (Dull, Graham & Baldwin, 2003). There are lot of information that are found through footnotes as these information are not presented clearly in financial statements such as policies for employees, compensation plans etc. Footnotes are also important to understand the method of accounting used by company and the impact of these methods on reported results.
References
- ABERCROMBIE & FITCH CO. (2011). 2010 Annual Report. Retrieved March 12, 2012 from http://www.abercrombie.com/anf/investors/investorrelations.html
- Bloomberg.Com. (2012). Income Statement for Hennes & Mauritz AB (HNNMY). Retrieved March 12, 2012 from http://www.bloomberg.com/quote/HNNMY:US/income-statement
- Brigham, E.F. & Houston, J.F. (2012). Fundamentals of financial management. USA: Cengage Learning.
- Dull, R.B., Graham, A.W. & Baldwin, A.A. (2003). Web-based financial statements: hypertext links to footnotes and their effect on decisions. International Journal of Accounting Information Systems, 4 (3), p. 185–203.
- Fridson, M.S. & Alvarez, F. (2011). Financial Statement Analysis: A Practitioner’s Guide (4th ed.) USA: John Wiley & Sons.
- H&M. (2010). Full-Year Report 2010. Retrieved March 12, 2012 from http://feed.ne.cision.com/wpyfs/00/00/00/00/00/13/7F/61/wkr0005.pdf
- Spurga, R.C. (2004). Balance sheet basics: financial management for non-financial managers. USA: Ronald C. Spurga.
- Vandyck, C.K. (2006). Financial Ratio Analysis: A Handy Guidebook. Trafford Publishing.
- Vasigh, B., Fleming, K. & Mackay, L. (2010). Foundations of Airline Finance: Methodology and Practice. Ashgate Publishing, Ltd.